
Two ways in
For a market already in the console, select it in the market header and click D0 Analyze. D0 reads the chart structure, momentum, funding, and open interest for that market and answers in chat. See D0 Analyze.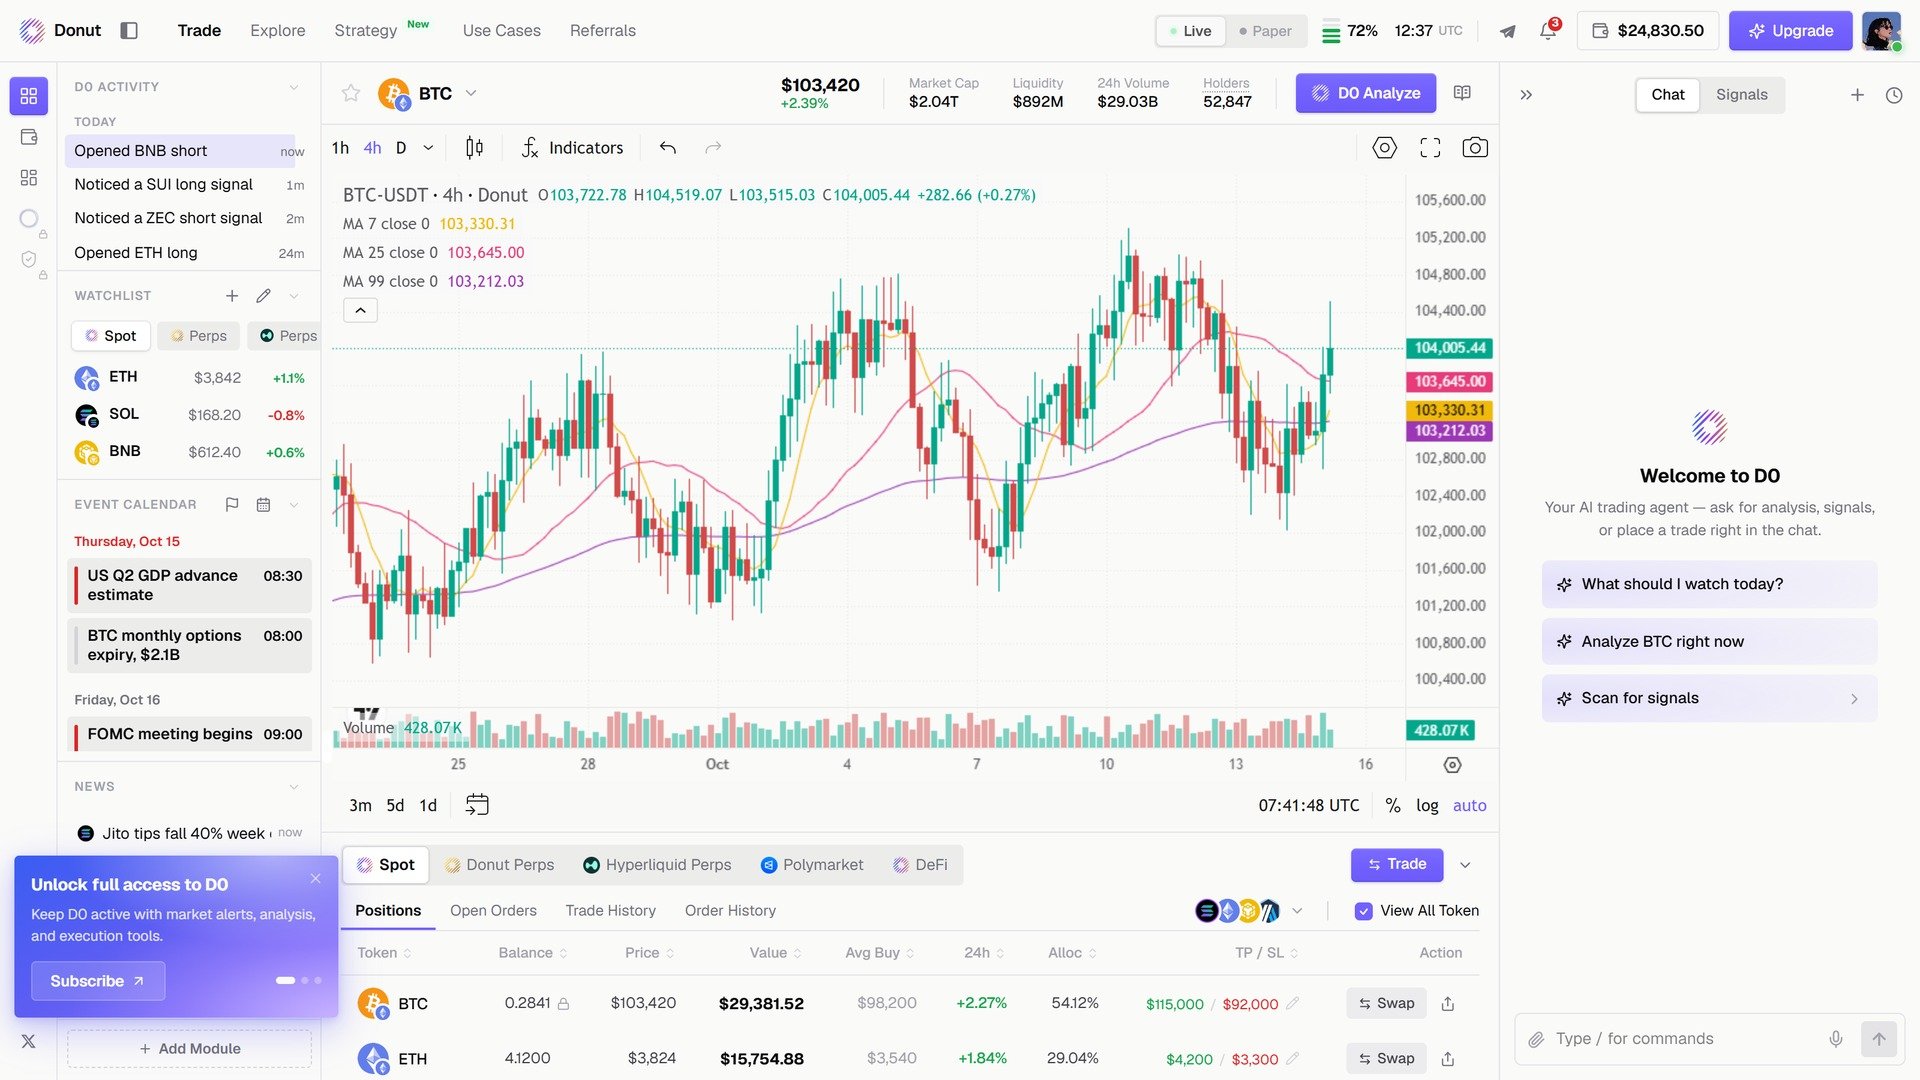
D0 Analyze reads the selected market from the header.
What D0 looks for
Chart patterns
- Trend direction: uptrend, downtrend, or ranging
- Pattern recognition: flags, wedges, triangles, head and shoulders, double tops and bottoms
- Support and resistance: price levels where the price has bounced or reversed before
Technical indicators
- RSI (Relative Strength Index): overbought or oversold
- MACD: momentum and trend strength signals
- Moving averages: where the price stands relative to the 20, 50, and 200
- Bollinger Bands: volatility and potential breakout zones
- Volume: whether the move is backed by strong volume
Trade insights
- Suggested entry and exit zones based on the analysis
- Risk level: how risky the current setup looks
- Timeframe context: whether the signal is short-term or long-term
Example
You: (attaches a BTC/USDT 4H chart) “What does this chart look like?” D0: “Looking at this BTC 4H chart: Trend: Bullish. Higher highs and higher lows since the $94K support bounce. Pattern: A bull flag is forming between $97,500 and $99,200. This is typically a continuation pattern. Indicators:Like every market read, the answer ends in actions: Set alert at the reclaim level, Open trade ticket, Watch this market.Key levels:
- RSI at 58: neutral with room for upside
- MACD crossed bullish 8 hours ago
- Price is above the 20 and 50 MA
Summary: Moderately bullish setup. A breakout above $99,200 with volume could target $101,500. A drop below $96,500 would weaken the bullish case.”
- Support: $96,500 / $94,000
- Resistance: $99,200 / $101,500
Tips for best results
Send clear charts
- Use high-resolution screenshots
- Make sure the chart is not too zoomed in or out
- Include the timeframe indicator (1H, 4H, 1D, etc.) if visible
Add context
- Tell D0 what timeframe you’re interested in
- Mention if you’re looking at a specific pattern
- Ask targeted questions like “Is this a good entry for a long?” rather than just “What do you think?”
Combine with other features
After the chart analysis, you can:- Ask for a market analysis of the same token for fundamental context
- Set a price alert at the support or resistance levels D0 identified
- Check market sentiment to see if the broader market supports the setup
Chart reading works best with standard candlestick charts. Heatmaps, orderbook visuals, and custom indicator overlays may have limited analysis support.